


This is an archived article that was published on sltrib.com in 2016, and information in the article may be outdated. It is provided only for personal research purposes and may not be reprinted.
The big headline of a new poll by Public Policy Polling is that the majority of Utahns don't want Sen. Orrin Hatch to run for re-election in 2018.
The same poll offered up some less serious observations about Utahns' consumption of three major products: Coffee, alcohol and green Jell-O.
What's really fascinating about the numbers is how they break down along political and religious lines.
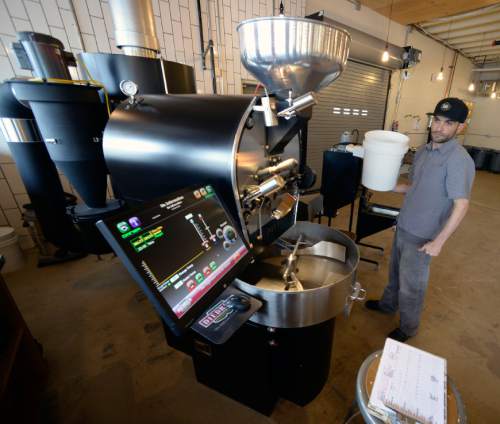
Coffee • Overall, 37 percent of poll respondents had a favorable opinion of coffee, while 44 percent had an unfavorable opinion, and 18 percent were not sure.
Unsurprisingly, religion played a big factor. Mormons, who are discouraged by doctrine from drinking coffee, were mostly negative — only 17 percent had a favorable opinion, compared to 63 percent unfavorable. For non-Mormons, the numbers are reversed sharply: 78 percent favorable to 6 percent favorable.
Gender is not much of a factor here, with men disliking coffee a bit more than women: A 34/44 split for men, and a 40/45 difference for women.
There was a difference by race. White people disliked coffee, 34 percent favorable to 49 percent unfavorable. Among Hispanics, 64 percent gave coffee a favorable rating, compared to 19 percent unfavorable. For other races, the split was 58 percent favorable and 13 percent unfavorable.
Among the age groups, only one — people 46 to 65 — went favorable, barely, 42 percent to 41 percent. The other groups were generally unfavorable toward coffee: The split was 34/54 for 18-to-29-year-olds, 33/50 for people 30 to 45, and 35/41 for folks over 65.
People who voted for Barack Obama in 2012 favored coffee, 68 percent to 18 percent, while Mitt Romney voters had an unfavorable view, 24/56. Democrats liked coffee (66/19), Republicans disliked it (23/60), and independents and "other" voters were OK with it (45/32). Liberals liked coffee (65/17 among those who identify as "very liberal," and 62/29 for "somewhat liberal"), as did moderates, with a 49/31 split — but conservatives don't like it (23/55 for "somewhat conservative," and 25/59 for "very conservative").
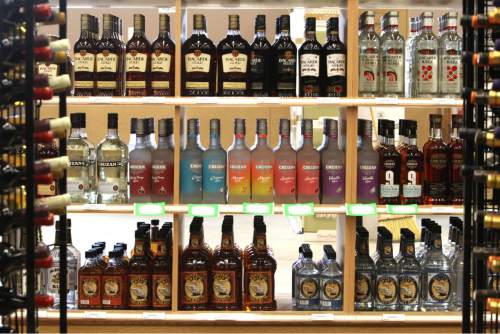
Alcohol • Overall, Utahns don't like alcohol much. Only 28 percent had a favorable opinion of booze, while 61 percent had an unfavorable impression.
Mormons, who are barred from consuming alcohol, have a very negative view of the stuff: 79 percent had unfavorable opinions, while 10 percent viewed it favorably. For non-Mormons, the favorable crowd was much larger — 63 percent, compared to 25 percent unfavorable.
White respondents were against alcohol, with 25 percent favorable and 65 percent unfavorable. Hispanics were favorable toward alcohol, 58 percent to 29 percent. Other races were equally split, 37 percent on each side.
The age breakdown was consistent: a 23/66 split for people 18 to 29; 22/65 for people 30 to 45; 35/54 for people 46 to 65, and 24/66 for people over 65.
Both women and men had unfavorable views on alcohol. The split was 27/63 for women, and 28/59 for men.
People who voted for Mitt Romney in 2012 really dislike alcohol — 15 percent favorable, 72 percent unfavorable — while 59 percent of Barack Obama voters had a favorable opinion and 34 percent had an unfavorable one. Democrats lean favorably, wiht a 50/42 split, Republicans are hard against it (16/76), and independents and "other" go 35/46 against. Liberals had a favorable leaning (a 47/38 among "very liberal," and a 59/34 split with "somewhat liberal"), while moderates were slightly opposed (38/48), and conservatives are really down on booze (14/74 for "somewhat conservative" and 14/78 for "very conservative").
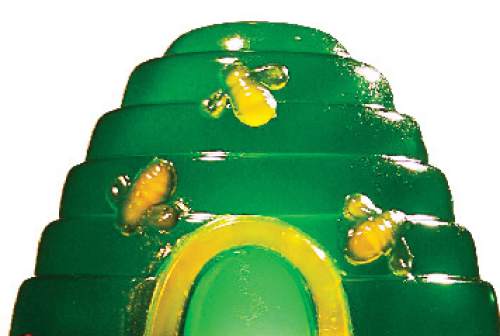
Green Jell-O • In the poll, 41 percent of the respondents said they had a favorable opinion of green Jell-O, while 32 percent had an unfavorable opinion of the jiggly foodstuff, and 27 percent were not sure.
As many women liked green Jell-O as didn't — 36 percent on each side — while men liked it more, 46 percent favorable to 28 percent unfavorable.
Hispanics, the poll found, like green Jell-O, 48 percent favorable to 31 percent unfavorable. So do white people, with 42 percent favorable and 32 percent unfavorable. Those identifying as "other" disliked Jell-O, 22 percent to 43 percent.
Broken down by age, the older one is, the more one likes green Jell-O. People over 65 were the most enthusiastic — 47 percent to 20 percent — while the split was 37/32 for people 46 to 65; 40/44 for people 30 to 45; and 41/40 for the 18-to-29 crowd.
Perhaps unsurprisingly, Mormons like green Jell-O more than non-Mormons. The split was 45/30 for Mormons, and 33/37 for non-Mormons.
People who voted for Mitt Romney in 2012 were more likely to like green Jell-O — a 45/28 split, favorable to unfavorable, compared to a 36/41 split for people who voted for Barack Obama.
Likewise, conservatives favored Jell-O (48/23 for "somewhat conservative" and 43/30 for "very conservative") while liberals tended to dislike it (24/51 for "somewhat conservative" and 35/54 for "very conservative"). Similar numbers were found for those identifying as Democrats (34/41) and Republicans (51/25), with those listing themselves as independent or other went against Jell-O, 26/41.